
NEW FOR 2024 -
FINALLY THE HIGHLY AWAITED IN-DEPTH VIDEO BANKERS CLUBCOURSE, MENTORSHIP AND COMPLETE ADDITIONAL BANKERS CLUB CHARTS PACKAGE IS NOW AVAILABLE FOR THE SERIOUS TRADERS
>>> CLICK HERE TO LEARN MORE <<<
APRIL 2024 UPDATED CALIBRATIONS
ALL CHARTS ARE NOW UPDATED OPTIMISED AND CALIBRATED FOR OPTIMUM PERFORMANCE
PROFESSIONAL TRADING CHARTS MADE BY THE BANKERS CLUB
OUR CHARTS ARE ONLY SUITABLE FOR THE SIERRA CHART PLATFORM MINIMUM OF SIERRA PACKAGE 5 REQUIRED.
THEY CAN BE USED FOR ANY INSTRUMENT YOU WISH TO TRADE
Below you will see the charts we use on a daily basis to help find areas of true supply and demand , using these charts to highlight areas of interest, we can start to stack confluences in our favour to increase the probability of making correct trading decisions. A lot of supply demand / smart money concept traders are now using our charts in conjunction with their previous trading knowledge and strategies to help add even more confluence to their trades. These charts and the way we use them could well be the missing link you've been looking for in your trading.
TO PURCHASE CHARTS PLEASE SCROLL DOWN TO BOTTOM OF PAGE.. FILES WILL BE SENT VIA EMAIL ALONG WITH SOME EXCLUSIVE VIDEOS TO HELP YOU UNDERSTAND HOW WE USE OUR CHARTS.

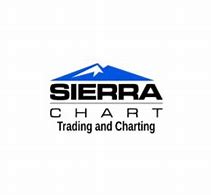
FOOTPRINT CHART
◼️ Numbers Bars Showing Market Buy / Sell Orders
◼️ Dominant Side Vol Colouring Percentages Profile
◼️ Volume At Each Price In candle
◼️ Volume In Candle (Shown Above Bar)
◼️ Delta Of Candle (Shown Above Bar)
◼️ POC Of Each Candle
◼️ Custom Stacked Footprint Imbalances
◼️ Current Day Vwap
◼️ Day Vol Profile (Shown On Right Side Of Chart)
This chart displays market order transactions taking place within each candlestick, we have the POC of each candle highlighted to show where most transactions are taking place, we have above the candle the amount of volume shown thats taken place within that candle, and above that the amount of delta within the candle, green numbers show more buyers, red numbers show more sellers. We also have a stacked imbalance set to show a specific percentage of imbalance. Standard day vwap is on the chart
RENKO FOOTPRINT CHART
◼️ Numbers Bars Showing Market Buy / Sell Orders
◼️ Volume In RENKO CANDLE (Shown Above Bar)
◼️ Delta Of RENKO CANDLE (Shown Above Bar)
◼️ POC Of Each Candle
◼️ Market Depth Highlights (Heat Map)
◼️ Current Day Vwap and 2 Standard Deviation bands
◼️ Stacked Imbalances
This chart displays market order transactions taking place within each Renko bar, we have the POC of each candle highlighted to show where most transactions are taking place, we have above the candle the amount of volume shown thats taken place within that candle, and above that the amount of delta within the candle, green numbers show more buyers, red numbers show more sellers. We also have added Market Depth Heat Map to highlight resting orders and a custom setting stacked imbalances, Standard day vwap is on the chart along with deviation band extremes
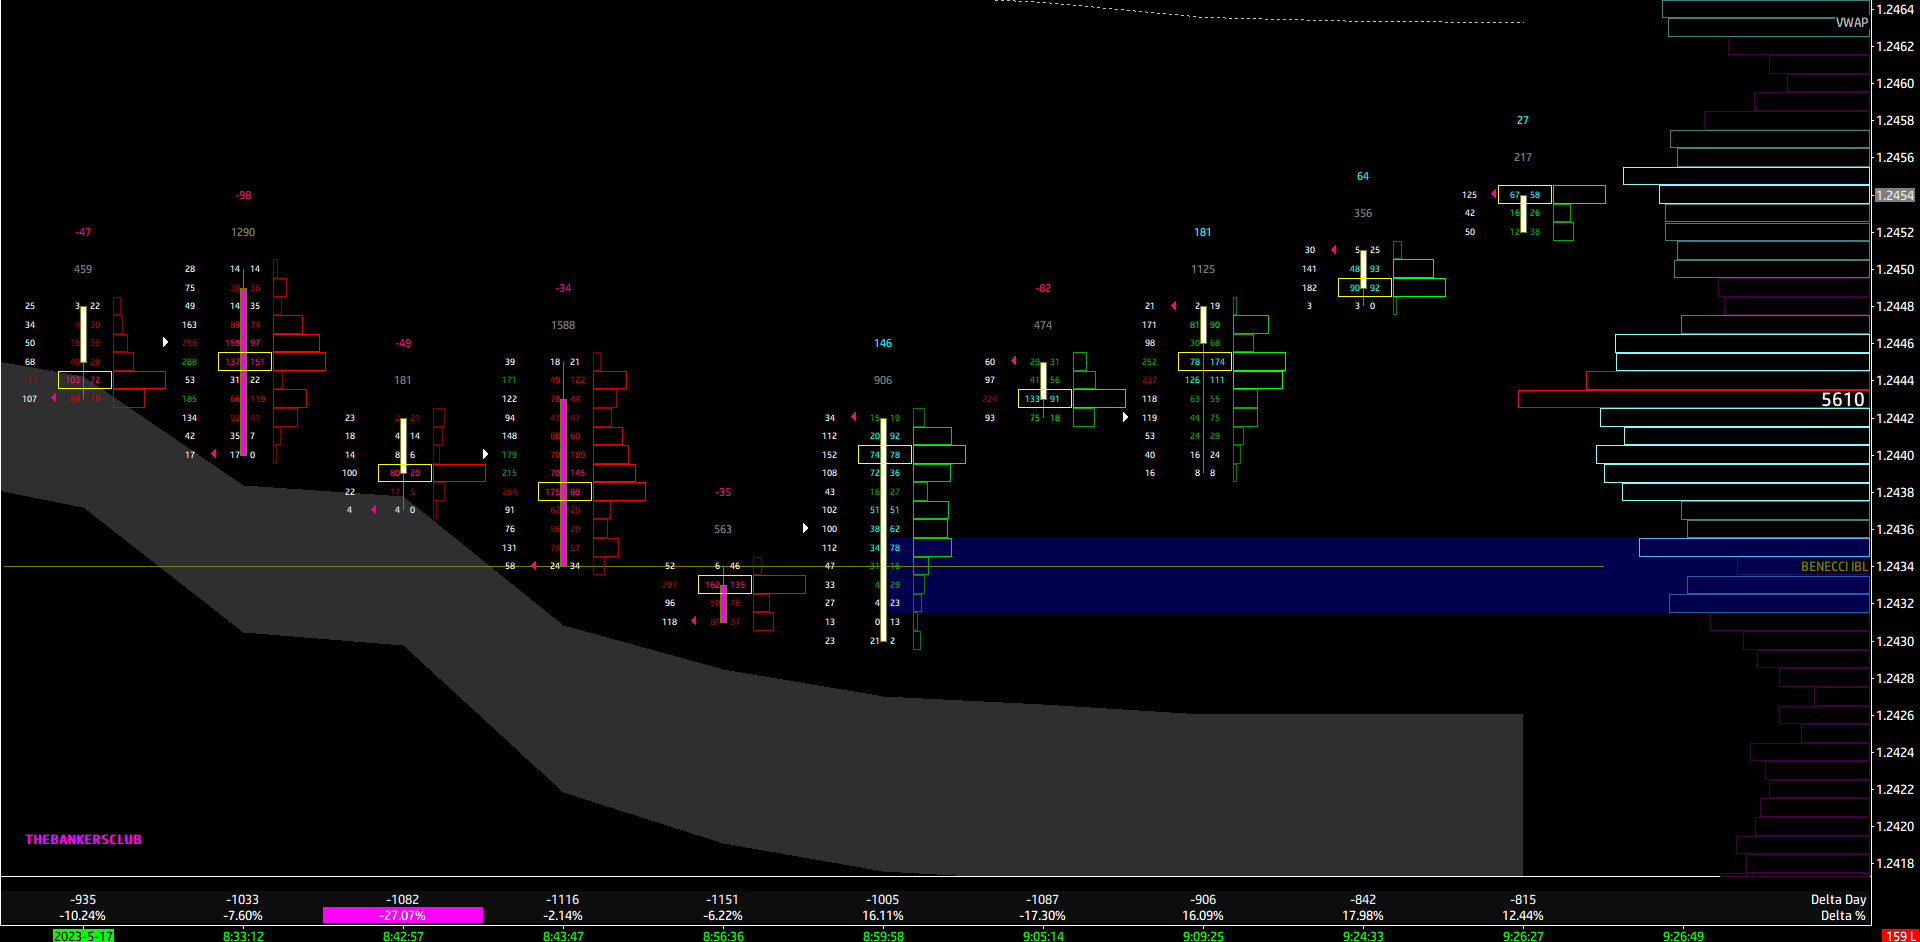
MONTHLY MARKET PROFILE
◼️ TPO (Market Profile
◼️ Value Areas
◼️ POC (Orange Line)
◼️ Custom Setting High Volume Node (Green Line) and Low Volume Node (Red Line)
◼️ Singleprint
This chart shows value areas, points of control, singleprints and also high and low volume nodes that are set to our own parameters
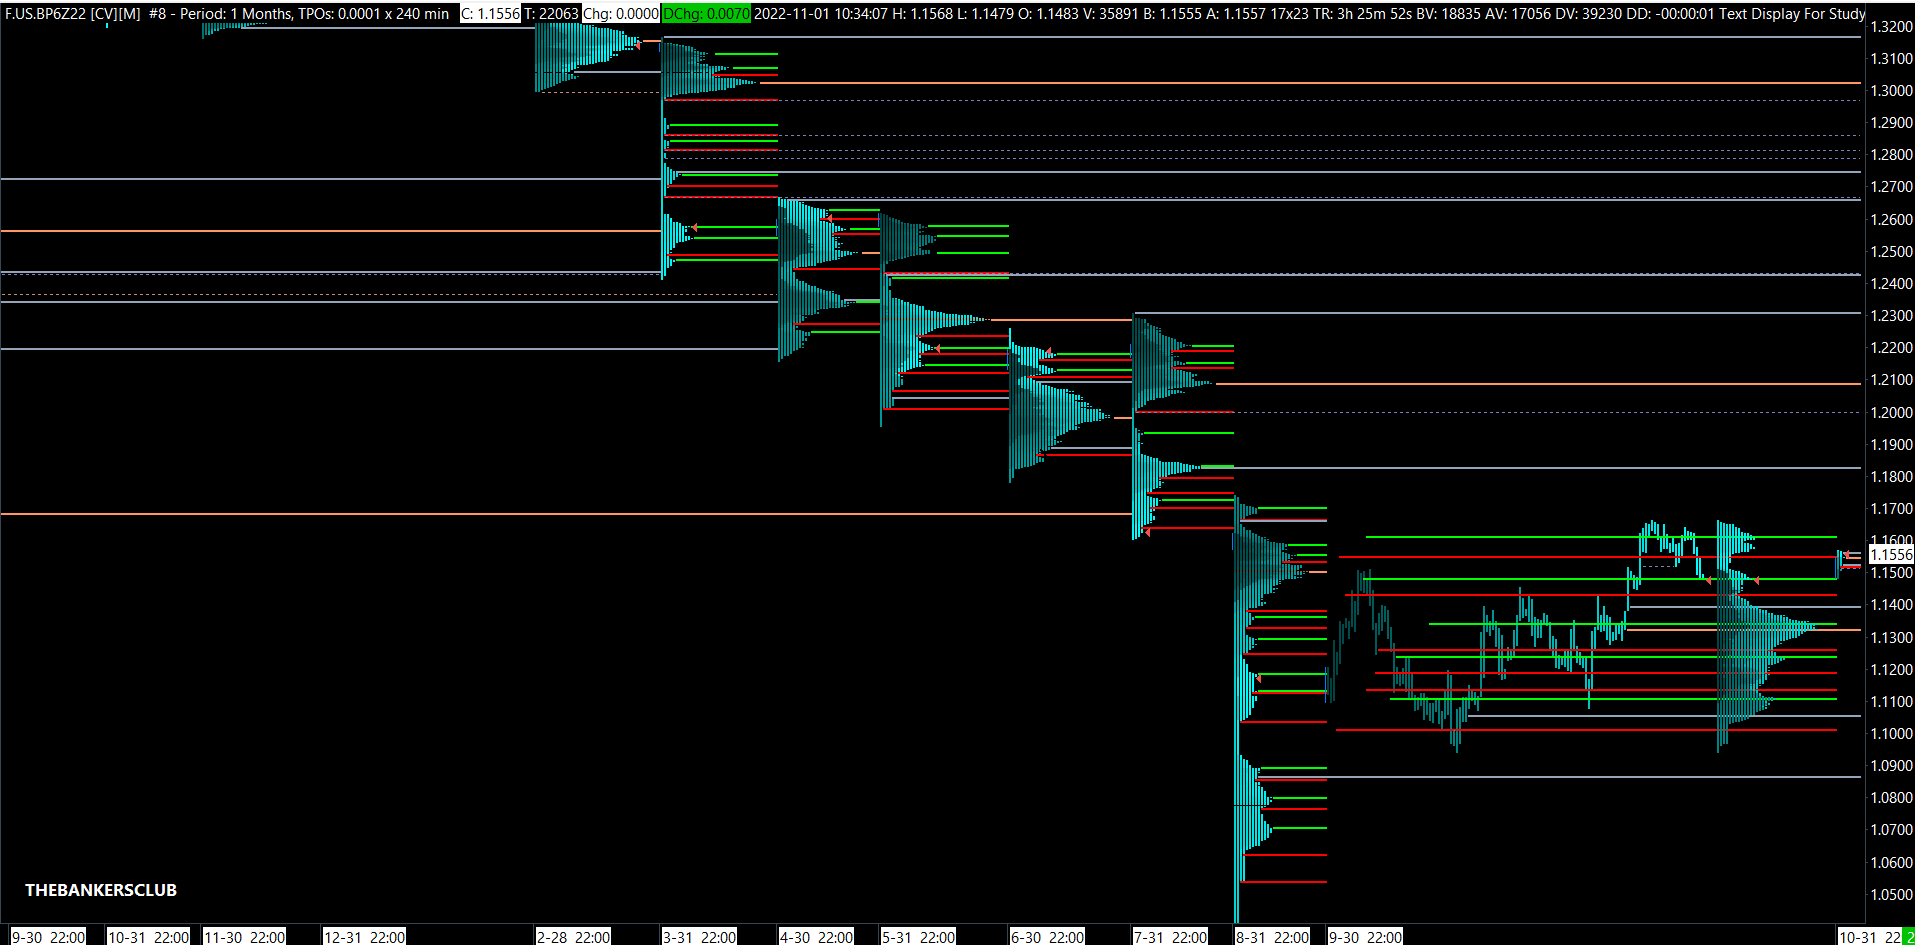
WEEKLY MARKET PROFILE + VOLUME PROFILE
◼️ TPO Market Profile ( Each Colour Within Profile Represents A Day)
◼️ Volume Profile (Shown as Histogram)
◼️ Value Areas
◼️ POC For Both Market (Orange Line) And Volume Profile (Yellow Line)
◼️ Custom Setting High Volume Node (Green Line) and Low Volume Node (Red Line)
◼️ Singleprint
This chart shows value areas, points of control, singleprints and also high and low volume nodes that are set to our own parameters
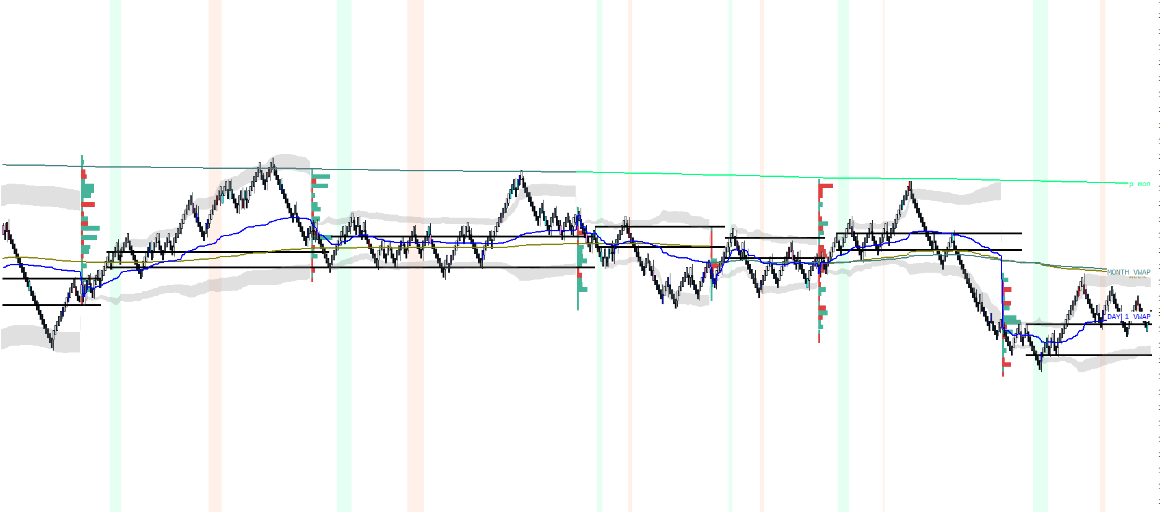
MULTI DAY VOLUME WEIGHTED AVERAGE PRICE (VWAP)
◼️ Current Day VWAP With 2 Standard Deviation Bands
◼️ Day 2 Vwap
◼️ Weekly Vwap
◼️ Monthly Vwap
◼️ Previous month vwap
◼️ High Delta / Volume Coloured Candle Highlight
◼️ Delta Profile on Left
◼️ Flexi Renko Bricks
◼️ Midas (Anchored) Vwap
This chart shows VWAPS for multiple days/weeks/months, along with a standard deviation band which we personally use in a specific trading environment, We also have a delta profile added, initial balance, session open markers, volume display within flexi renko bricks
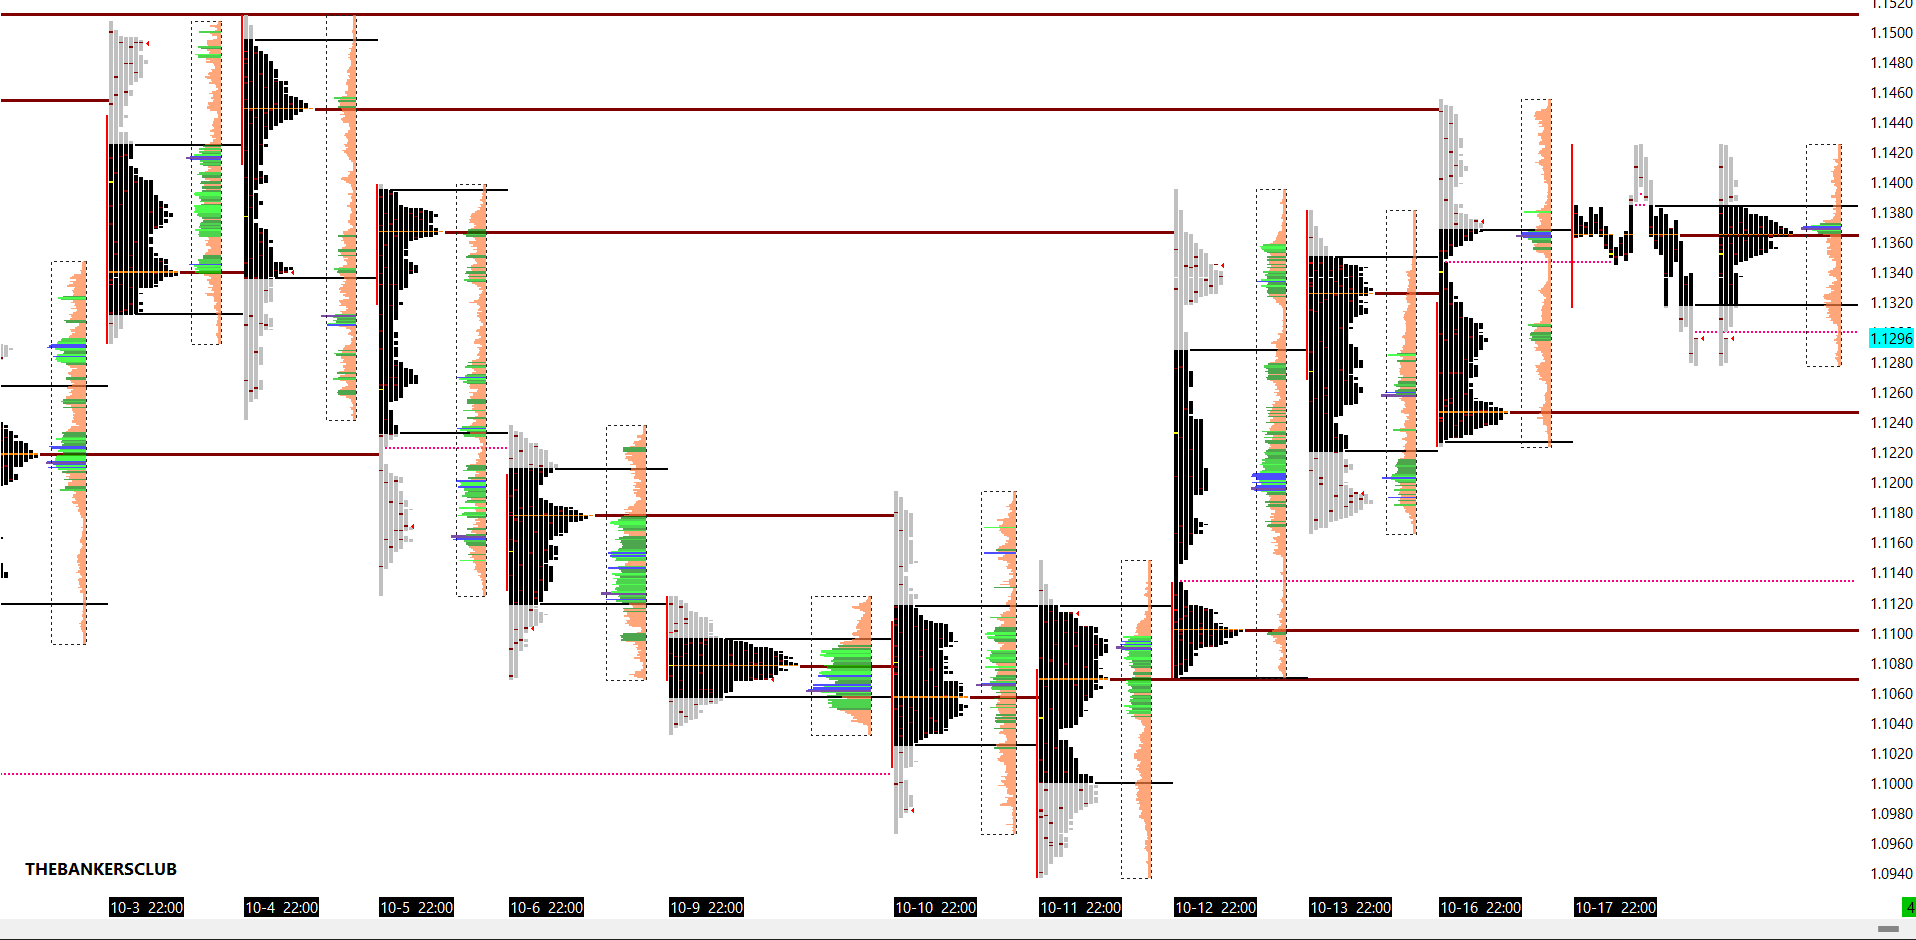
DAILY MARKET PROFILE + VOLUME PROFILE
◼️ TPO Market Profile
◼️ Volume Profile (With High Volume Areas Highlighted)
◼️ Value Areas
◼️ POC
◼️ Singleprint
This chart shows value areas, points of control, singleprints
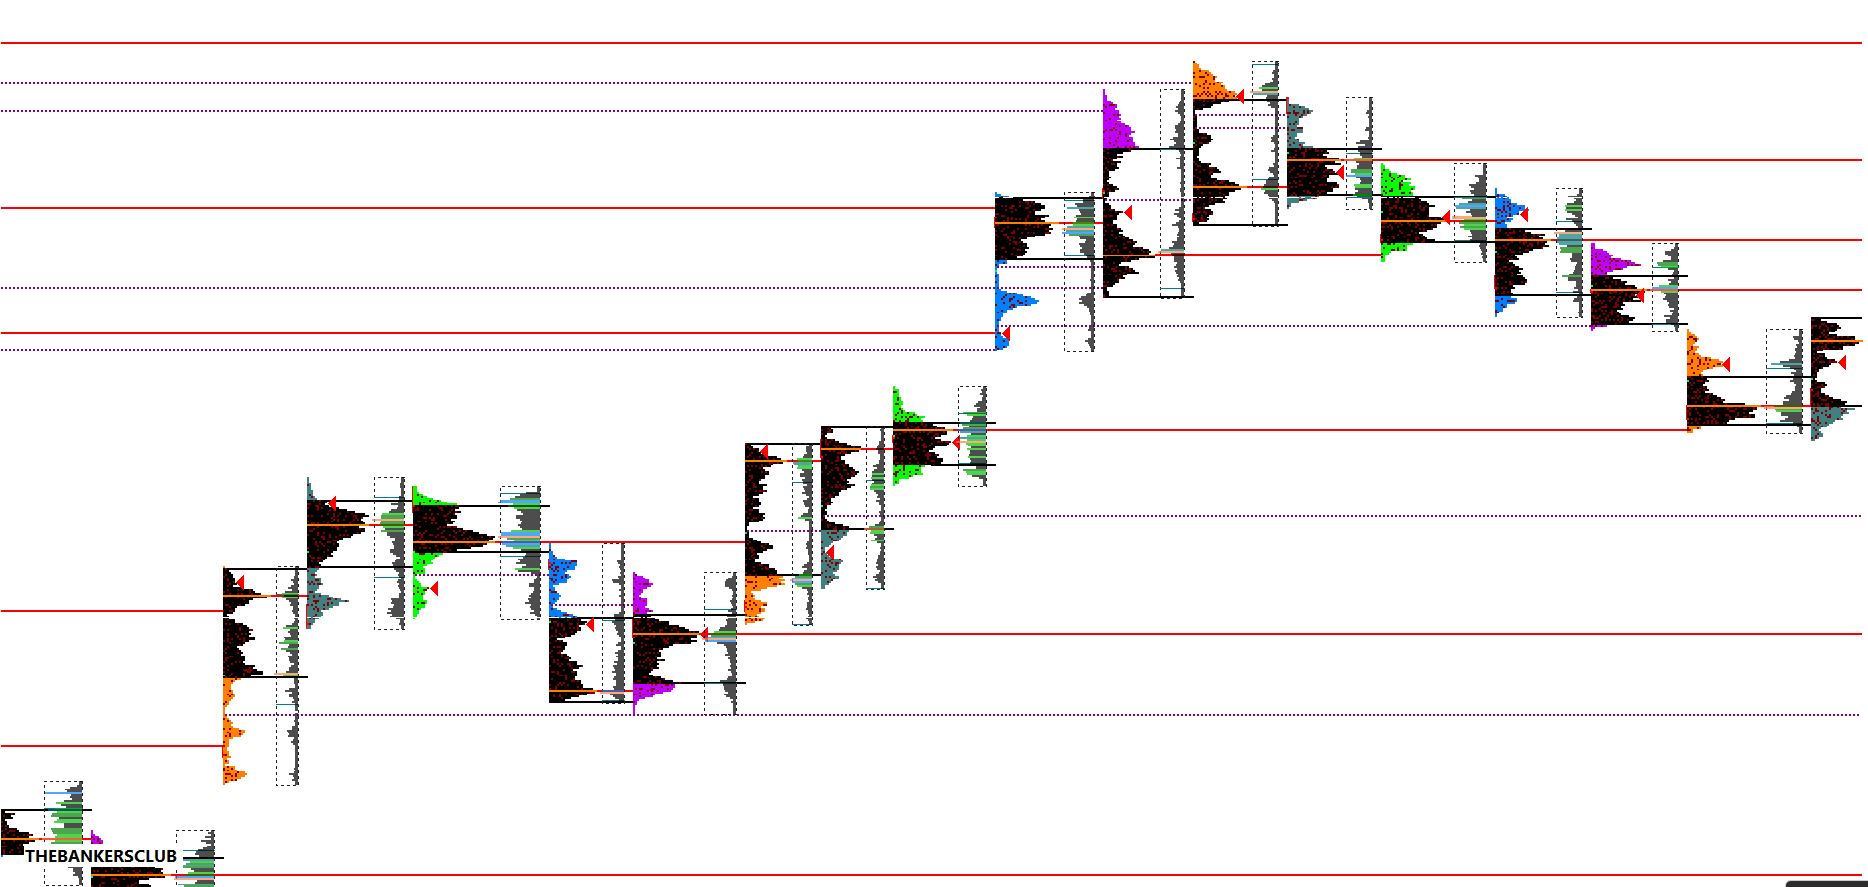
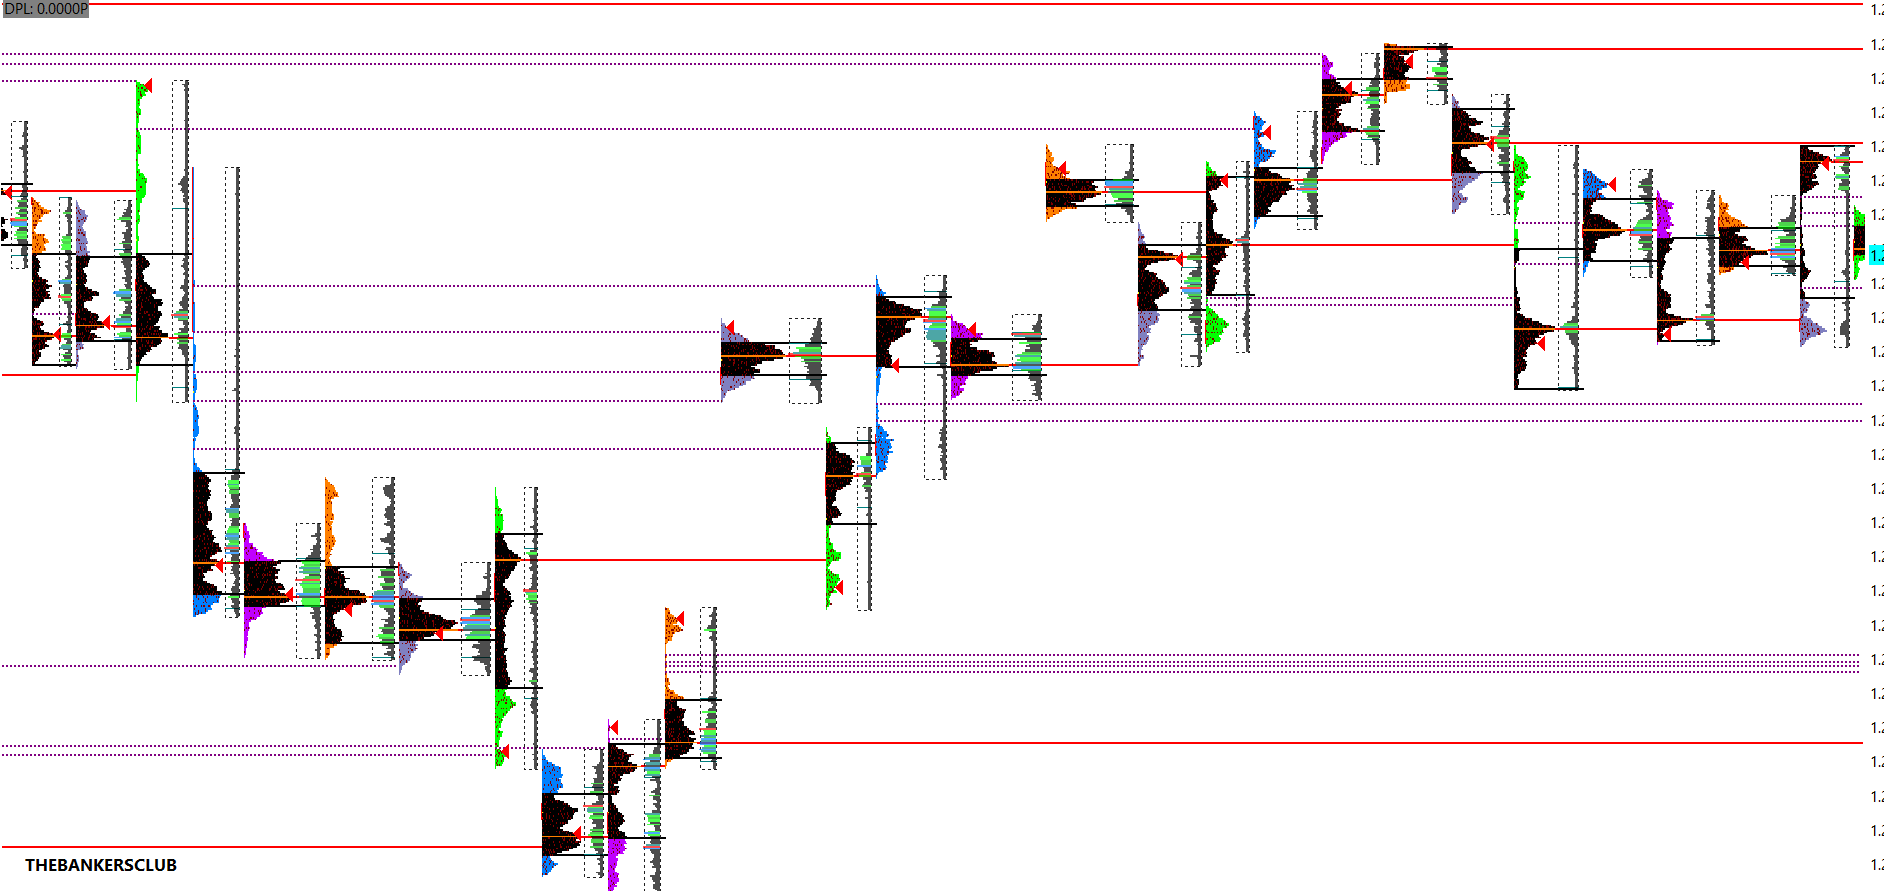
SPECIAL CUSTOM SESSION TPO CHARTS
◼️ TPO Market Profile
◼️ Volume Profile (With High Volume Areas Highlighted)
◼️ Value Areas
◼️ POC
◼️ Singleprint
SAME AS DAILY TPO CHART BUT WITH CUSTOM TIMEFRAME SETTINGS (NOT ETH RTH). This is our secret sauce to finding extra key hidden levels of supply demand.. How we use them is included in the videos we send out with the charts.
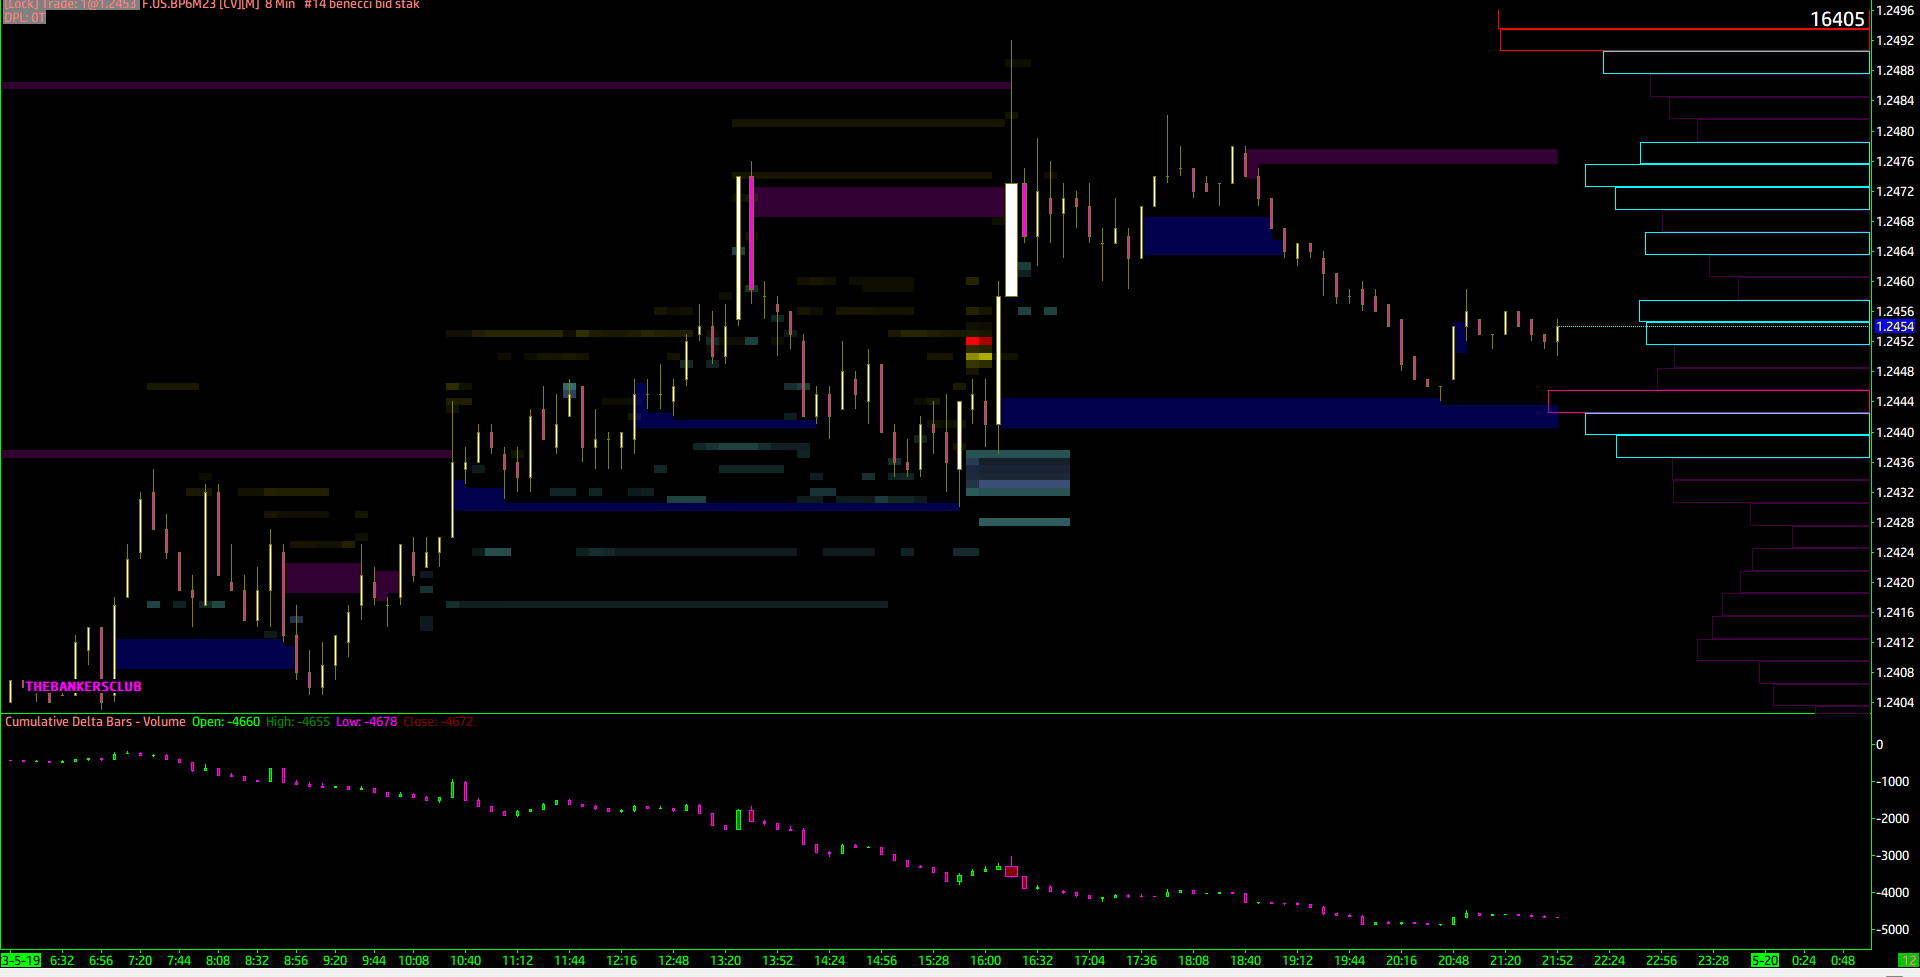
VOLUME CANDLESTICK WITH STACKED IMBALANCE AND MARKETDEPTH CHART
◼️ Candlestick volume bars
◼️ Custom spec Stacked Imbalances
◼️ Custom Sizing of Market Depth levels
◼️ Cumlative Delta Bars
◼️ Highest session Volume profile highlights
SA
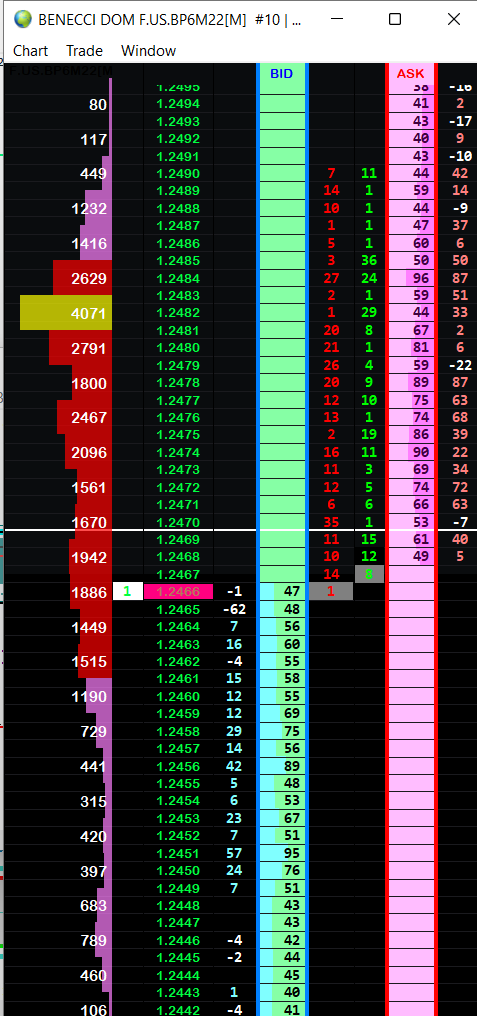
DEPTH OF MARKET (DOM)
◼️ Market Executions
◼️ Resting Orders With Increased Market Depth
◼️ Pulling And Stacking
◼️ Volume Profile
This chart shows pulling and stacking of orders, market executions and resting orders.
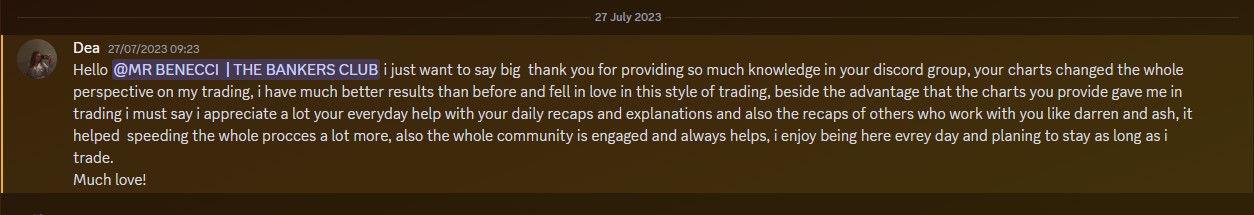
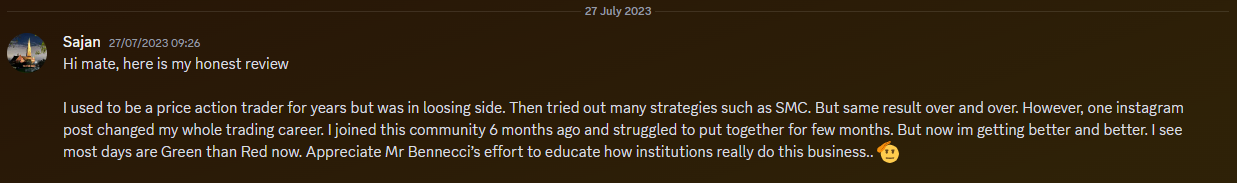
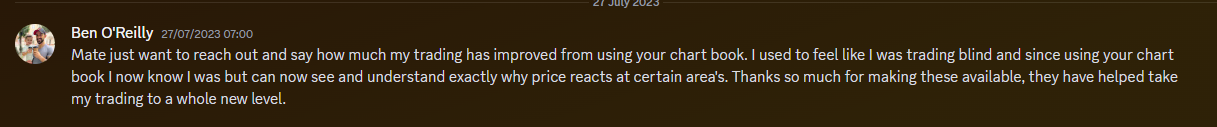
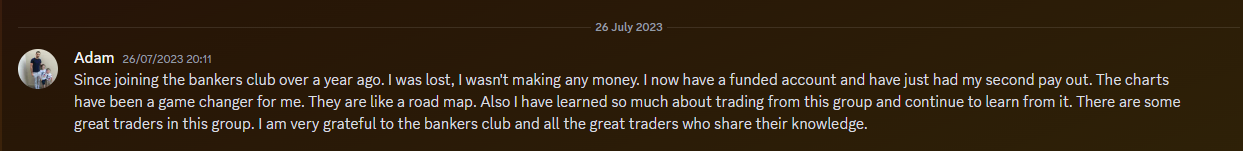
WHAT OUR CUSTOMERS SAY


live trade example
SHOP BELOW

.